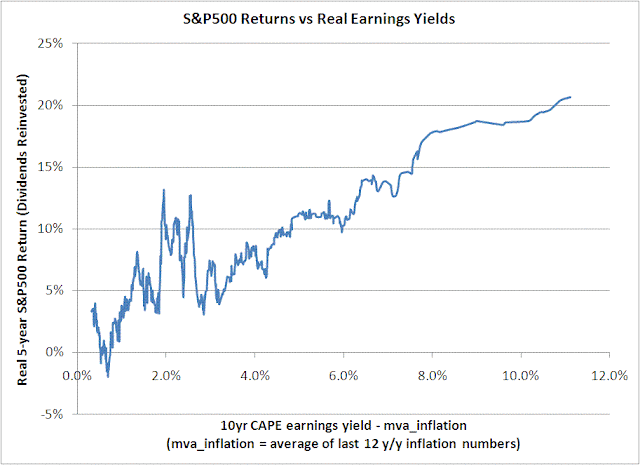
The graph below shows an interesting trend. Here's how I built it. Take every month from January 1950 to October 2006 (5 years ago). For each month, compute the 10-year CAPE (Robert Shiller's 10-year PE ratio). The inverse of this number can be used as an earnings yield. Then subtract what I call the "moving average inflation" which is simply the average of the last 12 year-over-year monthly inflation readings using the CPI. This gives a sense of the premium above inflation that the CAPE is giving you for investing in the S&P 500. I plotted this against the forward 5-year real returns (with dividends re-invested) for the S&P 500. I smoothed the graph by taking a sliding average of 20 points (sorted on the x-axis value).
The trend is that as the CAPE goes down (real earnings yield goes up) relative to inflation, the forward 5 year real returns are higher. It has some zigs and zags in it, but the trend is fairly strong.
Today I believe the CAPE would be between 17 (5.9%) and 20 (5%). The moving average inflation is at 2.4%. So the earnings yield is between 2.6% and 3.5%. The graph implies an expected real return in the 5-6% range. Looking directly at the data points (without the 20-point moving average), the spread of the returns is from -11% to +28% in this 2.6%-3.5% range, with an average of 7% and median of 6%.
All in all, another argument that stocks are cheap when compared to the real returns you can expect from any other investment.

No comments:
Post a Comment